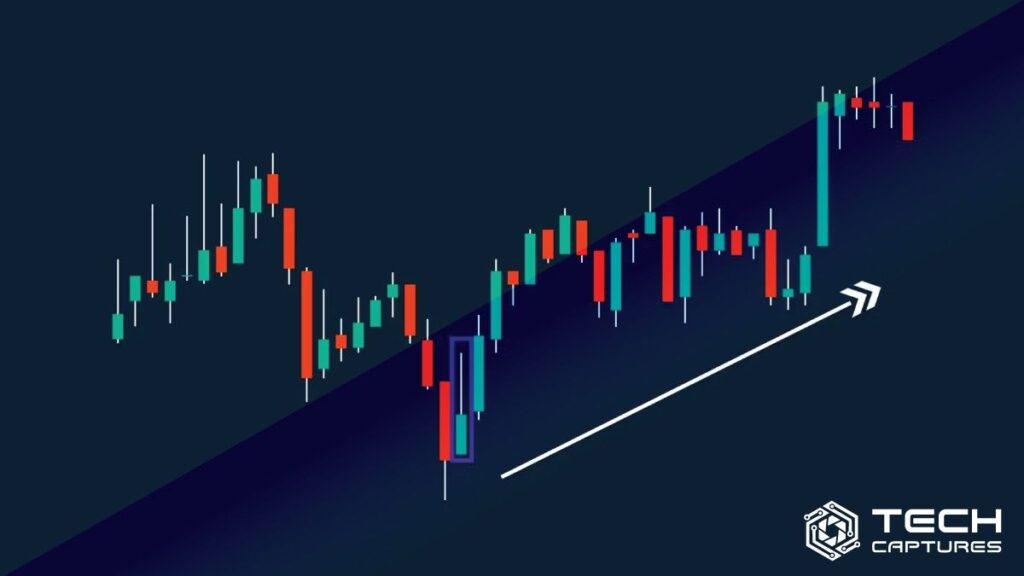
In the world of financial markets, knowledge is power. And when it comes to making informed decisions in trading, understanding trading candlestick patterns is a crucial tool in your arsenal. This article is your comprehensive guide to demystifying these patterns, allowing you to navigate the complexities of the trading world with confidence and precision.
Table of Contents
What are Trading Candlestick Patterns?
Let’s begin at the very beginning: What exactly are trading candlestick patterns? Candlestick patterns are a visual representation of price movements in a given time frame, typically used in technical analysis of financial markets. These patterns are made up of candlesticks, which consist of a rectangular “body” and two “wicks” extending from the top and bottom.
Where to Get the Best Insights?
To become skilled at using candlestick patterns, you need reliable resources. Books, online courses, and trading platforms often offer comprehensive guides and training. You can also check out online forums where experienced traders share their knowledge. One well-regarded resource is Investopedia, which has a vast library of articles and tutorials on candlestick patterns.
The Basics of Candlestick Structure
Now, let’s break down the structure of a candlestick. The body of the candlestick represents the price range between the opening and closing prices during a specific time frame. If the closing price is higher than the opening price, the candlestick is typically colored green or white, signifying a bullish trend. Conversely, if the closing price is lower than the opening price, the candlestick is red or black, indicating a bearish trend.
The upper and lower wicks, also known as shadows, extend above and below the body, representing the highest and lowest prices reached during the given time frame.
The Role of Candlestick Patterns in Technical Analysis
Candlestick patterns play a pivotal role in technical analysis. They provide valuable insights into market sentiment and potential price reversals. Traders use these patterns to identify entry and exit points, thereby maximizing their trading strategies’ effectiveness.
Candlestick patterns can be categorized into two groups: single-candlestick patterns and multi-candlestick patterns. Single patterns, like the Doji or Hammer, provide important signals on their own, while multi-candlestick patterns, such as the Bullish Engulfing or Bearish Harami, require the analysis of two or more candlesticks to make informed trading decisions.
Single Candlestick Patterns
Single candlestick patterns are often the building blocks of more complex patterns. Here are a few key single candlestick patterns:
- Doji: This pattern signifies market indecision, with the opening and closing prices nearly equal. It can indicate a potential reversal.
- Hammer: A Hammer pattern suggests a bullish reversal. It features a small body at the top and a long lower shadow, resembling a hammer.
- Shooting Star: The Shooting Star is the opposite of the Hammer, indicating a potential bearish reversal. It has a small body at the bottom and a long upper shadow.
Multi-Candlestick Patterns
Multi-candlestick patterns involve a sequence of candlesticks and offer more intricate insights. Some of the well-known multi-candlestick patterns include:
- Bullish Engulfing: This pattern consists of a small, bearish candlestick followed by a larger bullish one. It suggests a bullish reversal.
- Bearish Harami: A Bearish Harami features a large bullish candlestick followed by a small bearish one, indicating a potential bearish reversal.
- Morning Star: The Morning Star is a bullish reversal pattern. It starts with a bearish candle, followed by a small candle with a lower shadow, and ends with a large bullish candle.
Trading Strategies Using Candlestick Patterns
Candlestick patterns aren’t just for analysis; they’re also vital for forming
effective trading strategies. By recognizing these patterns and understanding their implications, traders can make more informed decisions. Some common strategies include:
- Swing Trading: Swing traders use candlestick patterns to identify potential short- to medium-term price swings.
- Day Trading: Day traders look for patterns within the same trading day to make quick, small profits.
- Long-Term Investing: Investors use candlestick patterns to determine optimal entry and exit points for long-term positions.
In this ever-evolving financial world, mastering the art of trading candlestick patterns is a continuous journey. By building your knowledge and experience in reading these patterns, you can significantly enhance your trading skills and increase your chances of success.
The Importance of Continuous Learning
Keep in mind that trading candlestick patterns, like any skill, requires ongoing learning and practice. A multitude of factors influences markets, and staying informed about economic news and global events is essential.
Reliable Resources for Learning
To excel in trading candlestick patterns, it’s important to consult reliable sources, attend seminars, and even consider mentorship from experienced traders.
Final Thoughts
In conclusion, understanding what trading candlestick patterns are and how to use them is an invaluable skill for traders and investors. These patterns offer insights into market sentiment and potential price movements, enabling you to make informed and strategic decisions. Start your journey toward mastering trading candlestick patterns today, and remember that continual learning and practice will be your greatest allies in this endeavor.

