

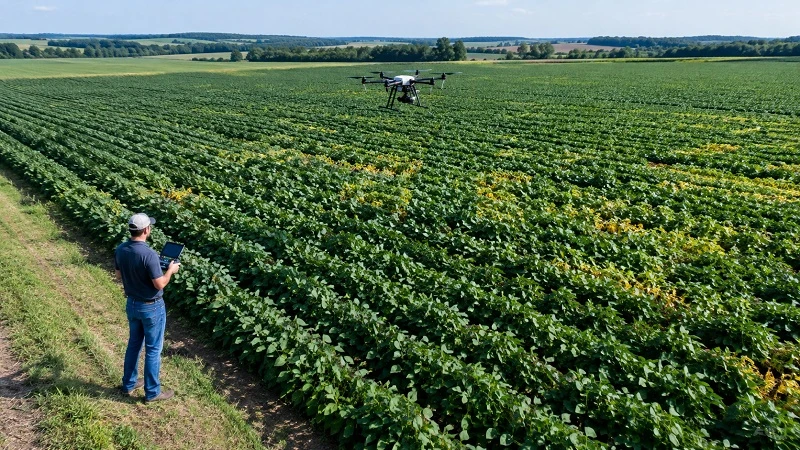
Why Early Detection Matters
A discoloured patch on a leaf can be easy to miss during a field inspection. Depending on the crop, pathogen, and growing conditions, it may be an early sign of disease. Once symptoms spread, growers can face fewer treatment options, higher management costs, and a greater risk of crop losses.
Visual scouting, field experience, and laboratory testing remain central to crop disease management. However, inspecting large areas takes time, and symptoms may develop unevenly between visits. Image analysis and remote sensing can help growers monitor more of a field and identify areas that need closer attention.
Crop Disease Detection brings these methods together. Images, sensor readings, and machine learning can help flag possible symptoms, map affected areas, and guide follow-up inspections. Used alongside agricultural expertise, these tools give growers more information to work with when deciding how to respond.
Table of Contents
Reading Plant Symptoms
Crop diseases vary in how they develop and what they look like. Symptoms depend on the pathogen, crop species, variety, growth stage, and surrounding conditions.
Fungal diseases may produce leaf spots, powdery growth, rust-coloured lesions, or blight. Bacterial infections can cause water-soaked areas, wilting, and tissue damage. Viral diseases may appear as mosaic patterns, distorted leaves, stunted growth, or changes in colour.
These signs are not always specific to a disease. Yellowing, for instance, can result from an infection, nutrient deficiency, water stress, root damage, or chemical injury. Colour alone is rarely enough to establish the cause.
Imaging tools can identify patterns associated with known diseases, but those findings need context. Crop history, recent weather, local disease prevalence, and laboratory results may all be relevant. A flagged image can tell a grower where to look; it does not necessarily tell them which treatment to use.
From Field Scouting to Image-Based Monitoring
Experienced growers and crop consultants inspect leaves, stems, fruit, and other plant structures to assess crop health. They can compare symptoms across locations and decide whether a suspected problem needs further investigation.
The difficulty is maintaining that coverage across a large farm. Scouting takes labour, and findings can vary with the observer, inspection frequency, and visibility of symptoms. Problems may also develop between visits.
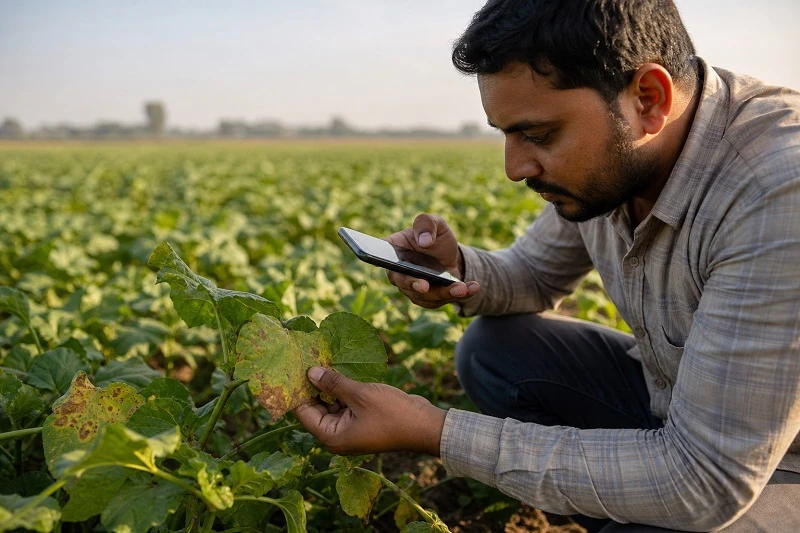
Image-based monitoring adds another source of observations. Depending on the detail required, images can come from smartphones, handheld cameras, tractor-mounted equipment, drones, or satellites.
Computer vision models analyse features such as lesion shape, colour differences, leaf texture, and changes in the crop canopy. They can process large image collections and highlight areas for review, helping farm teams focus their scouting efforts.
Field verification remains important. An agronomist or trained grower can examine flagged plants and assess details that may be missing from the images.
How AI Analyses Crop Images
AI-based disease detection starts with data collection. Image quality affects every later stage: blurred photographs, obstructed leaves, uneven lighting, and unclear symptoms can make analysis less reliable.
Before analysis, images may be processed to reduce noise, adjust contrast, or separate plant material from the background. A machine learning model then examines the visual features.
Convolutional neural networks are commonly used for this kind of image recognition. During training, they learn patterns from labelled examples, including edges, textures, shapes, and combinations of features associated with particular symptoms.
Depending on its design, a model may:
- Classify an image as healthy or showing symptoms associated with a known disease.
- Locate affected regions within an image.
- Estimate the extent of visible symptoms.
- Produce a map of potential disease locations.
These outputs answer different questions. An image classification does not establish how much of a field is affected, and a confidence score should not be read as a measure of disease severity.
Training conditions matter too. A model developed with isolated leaves photographed against clean backgrounds may perform differently outdoors. Field images include overlapping foliage, variable sunlight, background vegetation, and symptoms at different stages. Testing on representative field data is therefore an important part of evaluating a system.
What Different Sensors Can Reveal
Standard photographs record visible changes in plant appearance. Other sensors capture information about reflectance or temperature that may help reveal changes not yet obvious to the eye.
Multispectral imaging
Multispectral cameras record selected wavelength bands, including bands outside the visible spectrum. Changes in reflectance can help identify differences in plant condition that a conventional photograph may not show clearly.
Hyperspectral imaging
Hyperspectral cameras record many narrow wavelength bands. This provides more detailed spectral information for investigating disease-related changes and distinguishing them from other forms of stress. The equipment and analysis can also be more complex and expensive.
Thermal imaging
Thermal cameras measure surface temperature patterns. Water stress, changes in plant physiology, and some disease processes can affect those patterns, making thermal data useful alongside other observations.
None of these measurements provides a diagnosis on its own. Different stresses can produce similar responses, while weather and data collection conditions can affect readings.
A review of UAV-based crop disease and pest monitoring examines how remote sensing imagery, machine learning, and deep learning are used in agricultural monitoring. It also discusses the crop characteristics and methodological limitations that influence their use.
Locating Problems Within a Field
A warning that disease may be present is more useful when it includes a location. Growers need to know which rows or sections to inspect before deciding whether intervention is necessary.
Georeferenced imagery connects observations to positions in the field. Repeated surveys can also help teams compare symptom patterns over time and identify areas where a problem appears to be spreading.
For example, symptoms concentrated along one field edge may prompt an investigation into moisture conditions, management practices, or a nearby source of infection. Similar symptoms scattered across several areas may call for a different scouting approach.
Map precision depends on GPS accuracy, image resolution, crop coverage, and survey timing. These limitations should be considered when using a map to plan inspections or treatment.
Turning Findings Into Crop Protection Decisions
After a potential disease is detected, the next task is to establish its likely cause and assess the risk. Some findings require expert inspection or laboratory confirmation before a management decision can be made.
Depending on the crop and disease, a response may involve removing infected plant material, adjusting irrigation, improving sanitation, changing management practices, or applying an approved crop protection product. Resistant varieties may also be relevant when planning future planting cycles.
Early detection can give growers more time to act, but not every symptom warrants chemical treatment. A mistaken diagnosis can lead to unnecessary applications and expense without addressing the underlying problem.
A practical workflow separates the stages:
- Identify and locate suspicious symptoms.
- Check the finding and investigate the likely cause.
- Assess disease pressure and the need for action.
- Select a response consistent with agronomic guidance and local regulations.
- Revisit the affected area to monitor changes.
AI-supported tools can help organise observations and compare successive surveys. Those records can support follow-up assessment, although changes after treatment still need to be interpreted in context.
Sairone and AI-Assisted Crop Monitoring
Saiwa’s Sairone platform is presented as an AI-based approach to analysing crop imagery and supporting agricultural monitoring. The company’s crop disease detection article discusses image-based methods using data from handheld devices, ground-based sensors, drones, and satellites.
For growers and consultants, the practical question is how the analysis supports fieldwork. Visual or spatial outputs can help direct inspections, organise observations, and inform management planning. Their usefulness depends on the available imagery, the analysis performed, and how the findings fit into the farm’s existing workflow.
The distinction between a general detection method and a specific platform capability also matters. A description of AI-based disease detection does not, by itself, establish that every method or data source discussed is supported in every deployment.
As with other image-analysis systems, results need to be assessed against input quality, model coverage, and field conditions. They should support agronomic judgement rather than be treated as a confirmed diagnosis.
Where Automated Detection Can Fall Short
Field conditions are difficult to reproduce in a training dataset. Sunlight changes, leaves overlap, wind affects image capture, and different diseases can produce similar symptoms.
Models may also struggle with crop varieties, disease stages, or regional conditions that are poorly represented in their training data. Good performance in one setting does not guarantee the same results elsewhere.
Errors have different consequences. A false positive flags a problem that is not present and may lead to unnecessary inspection or treatment. A false negative misses a real problem and can delay action.
When evaluating a system, growers and consultants should look beyond a headline accuracy figure. Relevant questions include:
- Was the model tested on independent field data?
- Were the intended crops and diseases included in that testing?
- How did it perform at different symptom stages?
- How often did it miss disease or flag healthy plants?
- Are its outputs clear enough to guide field inspections?
Expert assessment or laboratory testing may still be needed, particularly when a wrong diagnosis would have significant consequences.
Building a Practical Monitoring Routine
A monitoring programme should start with the crop, the diseases of concern, and the decisions growers need to make. The most complex technology is not always the most useful choice.
For some farms, regular scouting supported by smartphone photographs may be enough. Larger operations may use drone surveys or satellite observations to identify areas for closer inspection. Specialised investigations may require multispectral, hyperspectral, or thermal data.
Consistent records make these observations easier to interpret. Useful details include the date, location, crop stage, weather conditions, and visible symptoms. Follow-up inspections can then show whether symptoms are progressing, remaining stable, or declining.
Timing and usability are just as important as the analysis itself. A result that arrives after the treatment window, or cannot be traced to a field location, may have little practical value.
A workable monitoring routine connects image capture, analysis, field verification, and follow-up. AI can help teams review more observations and decide where to look next. The crop protection decision still depends on understanding what is happening in the field.
